Crestwood South
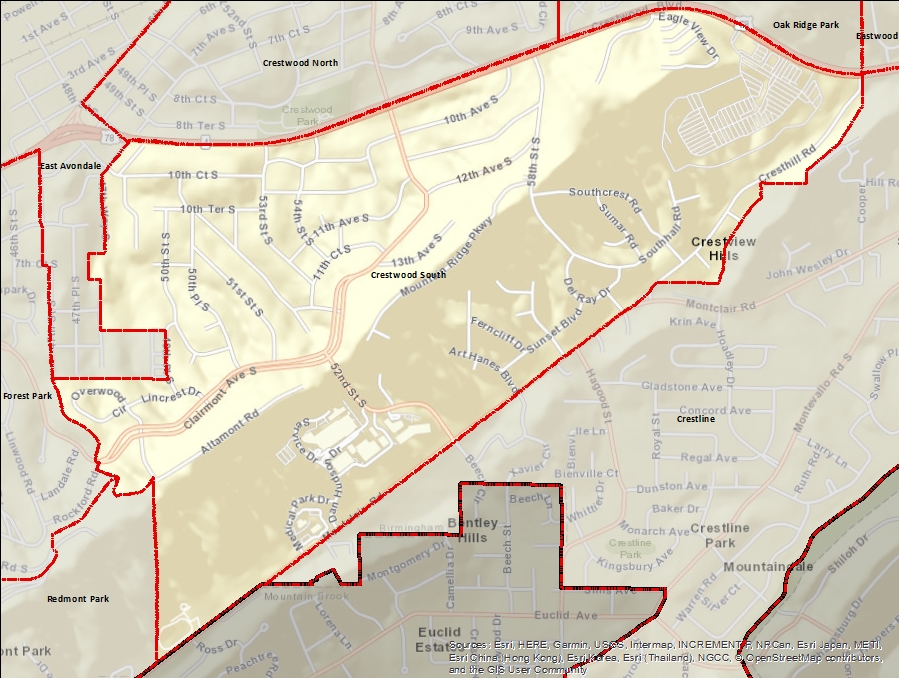
Crestwood South is a neighborhood in the Crestwood community of Birmingham. It is divided from Crestwood North by Crestwood Boulevard.
Indicator Details
|
Indicators |
Primary Domain | Indicator Value | Rank | Tier | Indicator Weight |
|---|---|---|---|---|---|
| Walkability | Neighborhood Characteristics | 17 | 98 | Bottom | 4.00 |
| Voter Participation | Social Cohesion | 9.8% | 3 | Top | 1.00 |
| Visual Property Nuisances | Blight | 3.0% | 18 | Top | 5.00 |
| Violent Crime | Health Systems and Public Safety | 110.5 | 62 | Middle | 4.00 |
| Vacancy Rates | Housing | 9.0% | 11 | Top | 1.00 |
| Tree Cover | Natural Areas | 24.3% | 25 | Top | 1.00 |
| Travel Time to Work | Employment Opportunities | 20.7 | 21 | Top | 1.00 |
| Transit Accessibility | Transportation | 3.5 | 66 | Middle | 4.00 |
| Toxic Releases from Facilities | Environmental Hazards | 34.2% | 22 | Top | 1.00 |
| Tax Delinquent Properties | Blight | 0.6% | 5 | Top | 5.00 |
| School Readiness Scores | Educational Opportunities | -% | - | Data N/A | 1.00 |
| School Proximity to Traffic | Environmental Hazards | 0.0% | 1 | Top | 1.00 |
| Residential Proximity to Traffic | Environmental Hazards | 0.0% | 1 | Top | 1.00 |
| Residential Mobility | Social Cohesion | 83.9% | 48 | Middle | 1.00 |
| Reading Proficiency | Educational Opportunities | 10.3% | 62 | Middle | 3.00 |
| Public Health Nuisances | Health Systems and Public Safety | 22.6 | 14 | Top | 4.00 |
| Public Assisted Households | Employment Opportunities | 9.3% | 5 | Top | 1.00 |
| Proximity to Superfund Sites | Environmental Hazards | 0.0% | 1 | Top | 1.00 |
| Proximity to Brownfield Sites | Environmental Hazards | 0.0% | 1 | Top | 1.00 |
| Preventable Hospitalizations | Health Systems and Public Safety | - | - | Data N/A | 1.00 |
| Preschool Enrollment | Educational Opportunities | 13.4% | 66 | Middle | 3.00 |
| Pedestrian Connectivity | Transportation | 41 | 80 | Bottom | 4.00 |
| Pedestrian & Bicycle Injuries by Motor Vehicles | Health Systems and Public Safety | 0 | 1 | Top | 4.00 |
| Payday Loans | Economic Health | 0.7 | 49 | Middle | 1.00 |
| Offsite Alcohol Outlets | Neighborhood Characteristics | 0 | 1 | Top | 1.00 |
| Motor Vehicle Collisions | Health Systems and Public Safety | 2.8 | 28 | Top | 4.00 |
| Low Birth Weight | Health Systems and Public Safety | -% | - | Data N/A | 1.00 |
| Long-Term Unemployment | Employment Opportunities | 1.1% | 8 | Top | 1.00 |
| Local Business Vitality | Economic Health | 60.4% | 43 | Middle | 1.00 |
| Land Use Mix | Neighborhood Characteristics | 0.4 | 76 | Bottom | 1.00 |
| Infant Mortality Rate | Health Systems and Public Safety | 11.6 | 30 | Top | 1.00 |
| Household Transportation Costs | Transportation | 25.1% | 50 | Middle | 4.00 |
| High School Graduation Rate | Educational Opportunities | 72.4% | 86 | Bottom | 3.00 |
| Food Desert | Neighborhood Characteristics | 30.0% | 5 | Top | 2.00 |
| Excessive Housing Cost Burden | Housing | 21.8% | 6 | Top | 1.00 |
| Employment Rate | Employment Opportunities | 95.1% | 7 | Top | 1.00 |
| Commute Mode Share | Transportation | 8.9% | 84 | Bottom | 4.00 |
| Chronic School Absence | Health Systems and Public Safety | 28.2% | 69 | Bottom | 1.00 |
| Business Retention | Economic Health | 3.8% | 18 | Top | 1.00 |
| Blood Lead Levels in Children | Housing | -% | - | Data N/A | 1.00 |
| Age of Housing | Housing | 84.8% | 51 | Middle | 1.00 |
| Adult Educational Attainment | Educational Opportunities | 87.5% | 11 | Top | 3.00 |
| Access to Parks and Open Space | Natural Areas | 56.2% | 85 | Bottom | 1.00 |
| Access to Mainstream Financial Services | Economic Health | 62.5% | 5 | Top | 1.00 |
| Abandoned Structures | Blight | 2.9% | 4 | Top | 5.00 |
Demographic and Contextual Indicators
| Neighborhood | City Wide | |
|---|---|---|
| Racial and Ethnic Diversity | 0.4 | 0.44 |
| Population | 2,969 | 210,616 |
| Park Quality | 45.4 | |
| Life Expectancy | 79.1 | 78.8 |
| Income Inequality | 0.4 | 0.49 |
| Concentrated Poverty | 6.2% | 30.9% |