Graymont
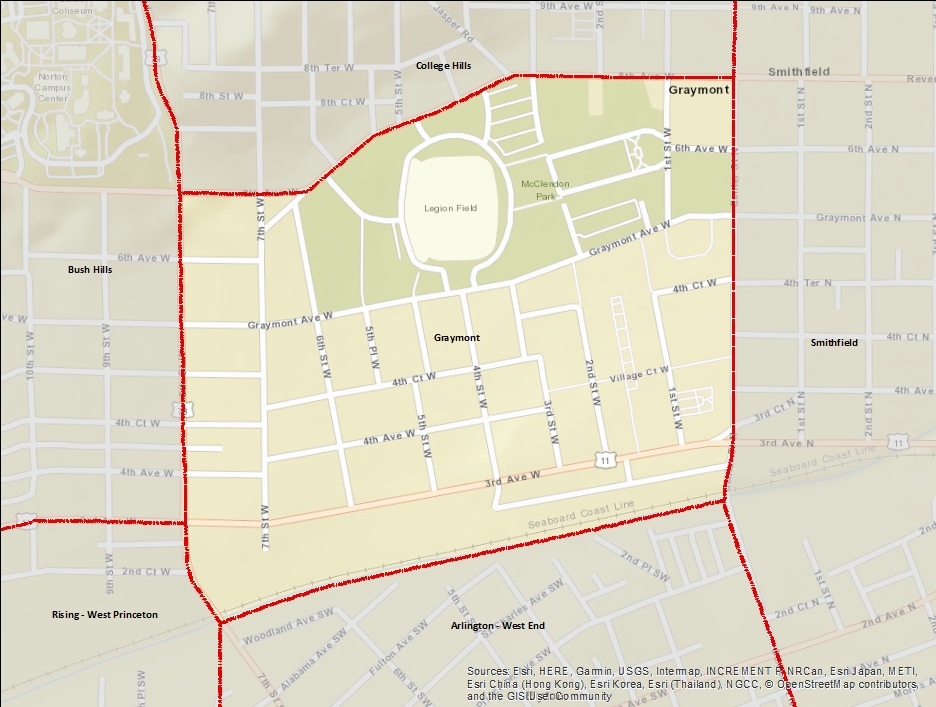
Graymont is a neighborhood in the Smithfield community centered around Graymont Avenue south of Legion Field. The neighborhood was originally a subdivision granted to Lucy Smith Gray by her father, Joseph Riley Smith, and is named in her honor. The Graymont neighborhood lies between College Hills across 8th Avenue West to the north, Smithfield across Center Street to the east, Arlington-West End across Valley Creek to the south, and Rising-West Princeton and Bush Hills across Princeton Parkway to the west. Legion Field anchors McLendon Park, which stretches across the northern half of the neighborhood. The Elyton Village housing project occupies most of the southeast quarter.
Indicator Details
|
Indicators |
Primary Domain | Indicator Value | Rank | Tier | Indicator Weight |
|---|---|---|---|---|---|
| Walkability | Neighborhood Characteristics | 74 | 27 | Top | 4.00 |
| Voter Participation | Social Cohesion | 4.2% | 81 | Bottom | 1.00 |
| Visual Property Nuisances | Blight | 9.7% | 35 | Middle | 5.00 |
| Violent Crime | Health Systems and Public Safety | 138.1 | 73 | Bottom | 4.00 |
| Vacancy Rates | Housing | 17.4% | 39 | Middle | 1.00 |
| Tree Cover | Natural Areas | 0.0% | 77 | Bottom | 1.00 |
| Travel Time to Work | Employment Opportunities | 21.7 | 33 | Top | 1.00 |
| Transit Accessibility | Transportation | 12.4 | 10 | Top | 4.00 |
| Toxic Releases from Facilities | Environmental Hazards | 100.0% | 75 | Bottom | 1.00 |
| Tax Delinquent Properties | Blight | 16.8% | 39 | Middle | 5.00 |
| School Readiness Scores | Educational Opportunities | -% | - | Data N/A | 1.00 |
| School Proximity to Traffic | Environmental Hazards | 0.0% | 1 | Top | 1.00 |
| Residential Proximity to Traffic | Environmental Hazards | 0.0% | 1 | Top | 1.00 |
| Residential Mobility | Social Cohesion | 85.6% | 37 | Middle | 1.00 |
| Reading Proficiency | Educational Opportunities | 12.2% | 51 | Middle | 3.00 |
| Public Health Nuisances | Health Systems and Public Safety | 42.5 | 25 | Top | 4.00 |
| Public Assisted Households | Employment Opportunities | 103.1% | 97 | Bottom | 1.00 |
| Proximity to Superfund Sites | Environmental Hazards | 0.0% | 1 | Top | 1.00 |
| Proximity to Brownfield Sites | Environmental Hazards | 0.1% | 74 | Bottom | 1.00 |
| Preventable Hospitalizations | Health Systems and Public Safety | - | - | Data N/A | 1.00 |
| Preschool Enrollment | Educational Opportunities | 13.8% | 65 | Middle | 3.00 |
| Pedestrian Connectivity | Transportation | 168 | 13 | Top | 4.00 |
| Pedestrian & Bicycle Injuries by Motor Vehicles | Health Systems and Public Safety | 0.2 | 55 | Middle | 4.00 |
| Payday Loans | Economic Health | 0.7 | 49 | Middle | 1.00 |
| Offsite Alcohol Outlets | Neighborhood Characteristics | 4 | 95 | Bottom | 1.00 |
| Motor Vehicle Collisions | Health Systems and Public Safety | 13.7 | 76 | Bottom | 4.00 |
| Low Birth Weight | Health Systems and Public Safety | -% | - | Data N/A | 1.00 |
| Long-Term Unemployment | Employment Opportunities | 7.7% | 94 | Bottom | 1.00 |
| Local Business Vitality | Economic Health | 58.6% | 49 | Middle | 1.00 |
| Land Use Mix | Neighborhood Characteristics | 0.6 | 39 | Middle | 1.00 |
| Infant Mortality Rate | Health Systems and Public Safety | 12.6 | 47 | Middle | 1.00 |
| Household Transportation Costs | Transportation | 21.6% | 10 | Top | 4.00 |
| High School Graduation Rate | Educational Opportunities | 80.6% | 15 | Top | 3.00 |
| Food Desert | Neighborhood Characteristics | 77.8% | 43 | Middle | 2.00 |
| Excessive Housing Cost Burden | Housing | 43.1% | 62 | Middle | 1.00 |
| Employment Rate | Employment Opportunities | 64.7% | 96 | Bottom | 1.00 |
| Commute Mode Share | Transportation | 16.6% | 47 | Middle | 4.00 |
| Chronic School Absence | Health Systems and Public Safety | 13.3% | 22 | Top | 1.00 |
| Business Retention | Economic Health | -21.6% | 88 | Bottom | 1.00 |
| Blood Lead Levels in Children | Housing | -% | - | Data N/A | 1.00 |
| Age of Housing | Housing | 94.3% | 95 | Bottom | 1.00 |
| Adult Educational Attainment | Educational Opportunities | 65.7% | 95 | Bottom | 3.00 |
| Access to Parks and Open Space | Natural Areas | 100.0% | 1 | Top | 1.00 |
| Access to Mainstream Financial Services | Economic Health | 23.9% | 79 | Bottom | 1.00 |
| Abandoned Structures | Blight | 18.1% | 84 | Bottom | 5.00 |
Demographic and Contextual Indicators
| Neighborhood | City Wide | |
|---|---|---|
| Racial and Ethnic Diversity | 0.1 | 0.44 |
| Population | 1,484 | 210,616 |
| Park Quality | 92.4 | |
| Life Expectancy | 70.3 | 78.8 |
| Income Inequality | 0.4 | 0.49 |
| Concentrated Poverty | 65.6% | 30.9% |