Jones Valley
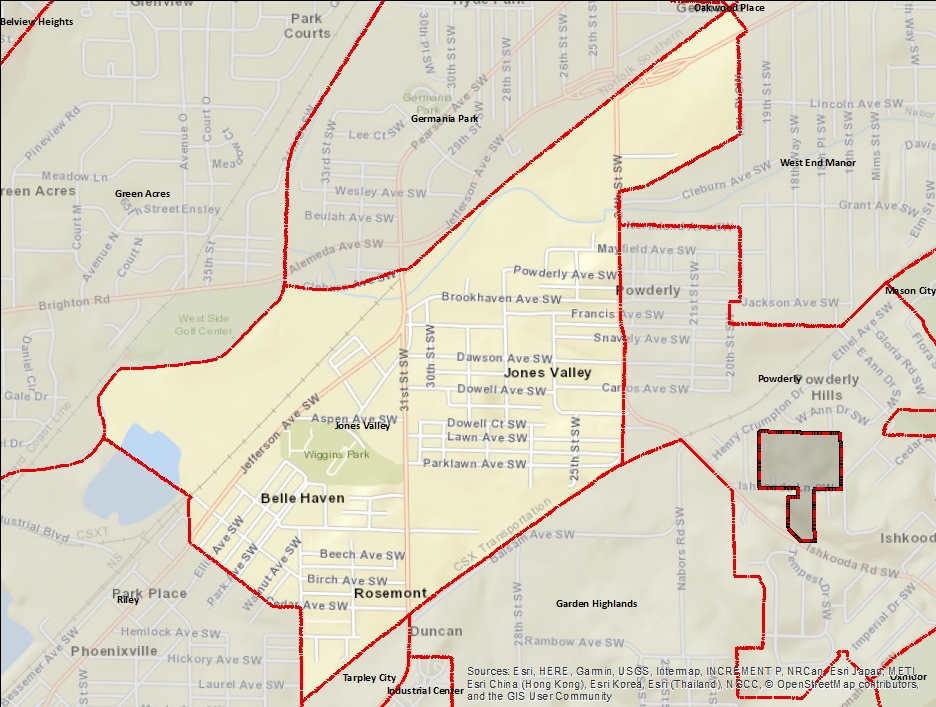
The Jones Valley neighborhood is a neighborhood in Birmingham's Southwest community. It is named for the larger Jones Valley in which Birmingham was developed. Jones Valley hosted the earliest pioneer settlements in what would later be called the Birmingham District. The homestead established in 1813 by John Jones at Fort Jonesboro gave the valley its name.
Indicator Details
| Indicators | Primary Domain | Indicator Value |
Rank |
Tier | Indicator Weight |
|---|---|---|---|---|---|
| Preventable Hospitalizations | Health Systems and Public Safety | - | - | Data N/A | 1.00 |
| Blood Lead Levels in Children | Housing | -% | - | Data N/A | 1.00 |
| Low Birth Weight | Health Systems and Public Safety | -% | - | Data N/A | 1.00 |
| School Readiness Scores | Educational Opportunities | -% | - | Data N/A | 1.00 |
| Pedestrian & Bicycle Injuries by Motor Vehicles | Health Systems and Public Safety | 0 | 1 | Top | 4.00 |
| Residential Proximity to Traffic | Environmental Hazards | 0.0% | 1 | Top | 1.00 |
| School Proximity to Traffic | Environmental Hazards | 0.0% | 1 | Top | 1.00 |
| Proximity to Brownfield Sites | Environmental Hazards | 0.0% | 1 | Top | 1.00 |
| Proximity to Superfund Sites | Environmental Hazards | 0.0% | 1 | Top | 1.00 |
| Land Use Mix | Neighborhood Characteristics | 0.7 | 9 | Top | 1.00 |
| High School Graduation Rate | Educational Opportunities | 80.0% | 25 | Top | 3.00 |
| Commute Mode Share | Transportation | 23.4% | 26 | Top | 4.00 |
| Public Assisted Households | Employment Opportunities | 32.4% | 32 | Top | 1.00 |
| Walkability | Neighborhood Characteristics | 70.5 | 33 | Top | 4.00 |
| Tree Cover | Natural Areas | 10.9% | 35 | Middle | 1.00 |
| Adult Educational Attainment | Educational Opportunities | 81.0% | 36 | Middle | 3.00 |
| Transit Accessibility | Transportation | 5.7 | 39 | Middle | 4.00 |
| Violent Crime | Health Systems and Public Safety | 80.1 | 43 | Middle | 4.00 |
| Business Retention | Economic Health | -7.3% | 44 | Middle | 1.00 |
| Motor Vehicle Collisions | Health Systems and Public Safety | 4.4 | 45 | Middle | 4.00 |
| Local Business Vitality | Economic Health | 57.9% | 51 | Middle | 1.00 |
| Offsite Alcohol Outlets | Neighborhood Characteristics | 0.6 | 53 | Middle | 1.00 |
| Travel Time to Work | Employment Opportunities | 24.9 | 54 | Middle | 1.00 |
| Residential Mobility | Social Cohesion | 82.0% | 54 | Middle | 1.00 |
| Pedestrian Connectivity | Transportation | 89 | 54 | Middle | 4.00 |
| Tax Delinquent Properties | Blight | 20.0% | 54 | Middle | 5.00 |
| Voter Participation | Social Cohesion | 5.2% | 55 | Middle | 1.00 |
| Excessive Housing Cost Burden | Housing | 41.9% | 56 | Middle | 1.00 |
| Food Desert | Neighborhood Characteristics | 100.0% | 56 | Middle | 2.00 |
| Household Transportation Costs | Transportation | 25.6% | 58 | Middle | 4.00 |
| Access to Parks and Open Space | Natural Areas | 87.7% | 62 | Middle | 1.00 |
| Toxic Releases from Facilities | Environmental Hazards | 90.4% | 64 | Middle | 1.00 |
| Employment Rate | Employment Opportunities | 82.0% | 64 | Middle | 1.00 |
| Payday Loans | Economic Health | 1.2 | 66 | Middle | 1.00 |
| Access to Mainstream Financial Services | Economic Health | 27.9% | 66 | Middle | 1.00 |
| Visual Property Nuisances | Blight | 19.6% | 67 | Bottom | 5.00 |
| Abandoned Structures | Blight | 16.1% | 73 | Bottom | 5.00 |
| Reading Proficiency | Educational Opportunities | 8.4% | 76 | Bottom | 3.00 |
| Preschool Enrollment | Educational Opportunities | 1.3% | 82 | Bottom | 3.00 |
| Long-Term Unemployment | Employment Opportunities | 5.3% | 84 | Bottom | 1.00 |
| Public Health Nuisances | Health Systems and Public Safety | 109 | 85 | Bottom | 4.00 |
| Vacancy Rates | Housing | 30.8% | 89 | Bottom | 1.00 |
| Age of Housing | Housing | 92.9% | 89 | Bottom | 1.00 |
| Chronic School Absence | Health Systems and Public Safety | 34.3% | 90 | Bottom | 1.00 |
| Infant Mortality Rate | Health Systems and Public Safety | 20.3 | 91 | Bottom | 1.00 |
Demographic and Contextual Indicators
| Neighborhood | City Wide | |
|---|---|---|
| Income Inequality | 0.4 | 0.49 |
| Concentrated Poverty | 21.1% | 30.9% |
| Life Expectancy | 70 | 78.8 |
| Population | 1,661 | 210,616 |
| Racial and Ethnic Diversity | 0 | 0.44 |
| Park Quality | 89.6 |