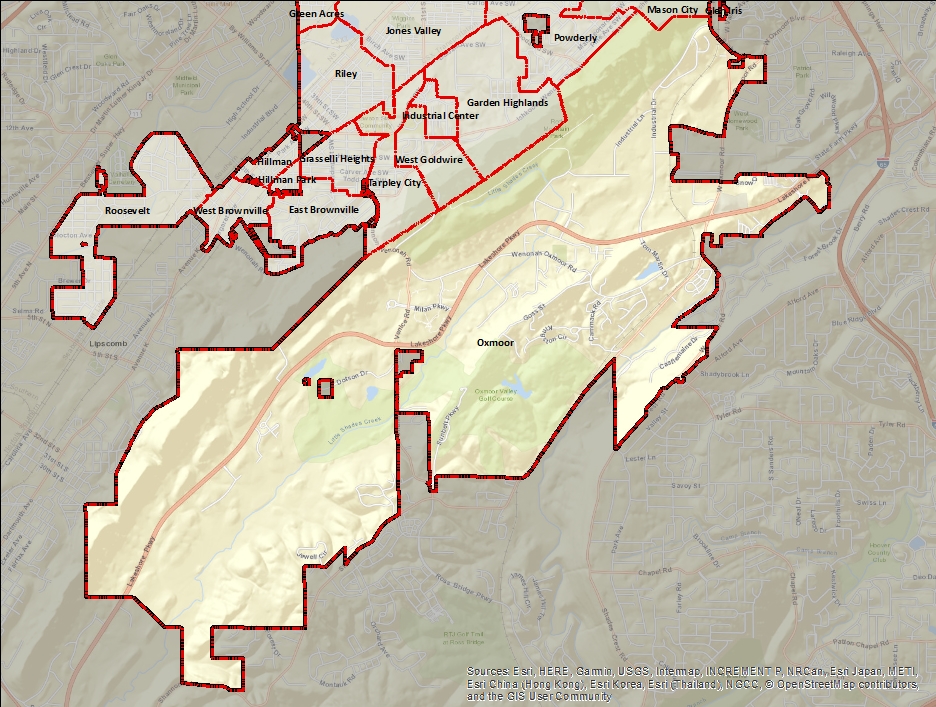
The Oxmoor neighborhood (known as the Sand Ridge neighborhood until 2006) is a neighborhood in Birmingham's Southwest community. The large, sparsely-populated area borders the cities of Homewood, Hoover, Bessemer and Lipscomb on the southwestern edge of the city limits, south of Red Mountain. It is traversed by Lakeshore Parkway, Shannon-Wenonah Road (Venice Road), Wenonah-Oxmoor Road (Sydney Drive), and Shannon-Oxmoor Road. North of the ridge of Red Mountain, Oxmoor is bounded by the Powderly, Mason City and Garden Highlands neighborhoods of the Southwest community, and by the West Goldwire and Tarpley City neighborhoods of the Grasselli community. It is divided by the administrative border between the Birmingham Division and Bessemer Cut-Off of Jefferson County.
Indicator Details
|
Indicators |
Primary Domain | Indicator Value | Rank | Tier | Indicator Weight |
|---|---|---|---|---|---|
| Abandoned Structures | Blight | 1.9% | 2 | Top | 5.00 |
| Access to Mainstream Financial Services | Economic Health | 61.4% | 6 | Top | 1.00 |
| Access to Parks and Open Space | Natural Areas | 90.8% | 54 | Middle | 1.00 |
| Adult Educational Attainment | Educational Opportunities | 95.2% | 2 | Top | 3.00 |
| Age of Housing | Housing | 11.9% | 1 | Top | 1.00 |
| Blood Lead Levels in Children | Housing | -% | - | Data N/A | 1.00 |
| Business Retention | Economic Health | 13.3% | 12 | Top | 1.00 |
| Chronic School Absence | Health Systems and Public Safety | 28.9% | 73 | Bottom | 1.00 |
| Commute Mode Share | Transportation | 8.3% | 87 | Bottom | 4.00 |
| Employment Rate | Employment Opportunities | 96.2% | 5 | Top | 1.00 |
| Excessive Housing Cost Burden | Housing | 31.2% | 19 | Top | 1.00 |
| Food Desert | Neighborhood Characteristics | 38.5% | 7 | Top | 2.00 |
| High School Graduation Rate | Educational Opportunities | 85.9% | 1 | Top | 3.00 |
| Household Transportation Costs | Transportation | 25.2% | 52 | Middle | 4.00 |
| Infant Mortality Rate | Health Systems and Public Safety | 7 | 12 | Top | 1.00 |
| Land Use Mix | Neighborhood Characteristics | 0.7 | 9 | Top | 1.00 |
| Local Business Vitality | Economic Health | 37.9% | 91 | Bottom | 1.00 |
| Long-Term Unemployment | Employment Opportunities | 0.5% | 1 | Top | 1.00 |
| Low Birth Weight | Health Systems and Public Safety | -% | - | Data N/A | 1.00 |
| Motor Vehicle Collisions | Health Systems and Public Safety | 2.9 | 31 | Top | 4.00 |
| Offsite Alcohol Outlets | Neighborhood Characteristics | 1.4 | 77 | Bottom | 1.00 |
| Payday Loans | Economic Health | 0.2 | 35 | Middle | 1.00 |
| Pedestrian & Bicycle Injuries by Motor Vehicles | Health Systems and Public Safety | 0 | 1 | Top | 4.00 |
| Pedestrian Connectivity | Transportation | 25 | 90 | Bottom | 4.00 |
| Preschool Enrollment | Educational Opportunities | 41.8% | 20 | Top | 3.00 |
| Preventable Hospitalizations | Health Systems and Public Safety | - | - | Data N/A | 1.00 |
| Proximity to Brownfield Sites | Environmental Hazards | 0.0% | 1 | Top | 1.00 |
| Proximity to Superfund Sites | Environmental Hazards | 1.8% | 57 | Middle | 1.00 |
| Public Assisted Households | Employment Opportunities | 8.2% | 4 | Top | 1.00 |
| Public Health Nuisances | Health Systems and Public Safety | 11.8 | 5 | Top | 4.00 |
| Reading Proficiency | Educational Opportunities | 7.0% | 84 | Bottom | 3.00 |
| Residential Mobility | Social Cohesion | 68.2% | 94 | Bottom | 1.00 |
| Residential Proximity to Traffic | Environmental Hazards | 0.0% | 1 | Top | 1.00 |
| School Proximity to Traffic | Environmental Hazards | 0.0% | 1 | Top | 1.00 |
| School Readiness Scores | Educational Opportunities | -% | - | Data N/A | 1.00 |
| Tax Delinquent Properties | Blight | 3.6% | 19 | Top | 5.00 |
| Toxic Releases from Facilities | Environmental Hazards | 73.0% | 44 | Middle | 1.00 |
| Transit Accessibility | Transportation | 4.2 | 56 | Middle | 4.00 |
| Travel Time to Work | Employment Opportunities | 23.9 | 38 | Middle | 1.00 |
| Tree Cover | Natural Areas | 55.1% | 8 | Top | 1.00 |
| Vacancy Rates | Housing | 13.5% | 28 | Top | 1.00 |
| Violent Crime | Health Systems and Public Safety | 44.3 | 11 | Top | 4.00 |
| Visual Property Nuisances | Blight | 0.5% | 1 | Top | 5.00 |
| Voter Participation | Social Cohesion | 5.7% | 44 | Middle | 1.00 |
| Walkability | Neighborhood Characteristics | 35 | 66 | Middle | 4.00 |
Demographic and Contextual Indicators
| Neighborhood | City Wide | |
|---|---|---|
| Concentrated Poverty | 16.2% | 30.9% |
| Income Inequality | 0.4 | 0.49 |
| Life Expectancy | 75.9 | 78.8 |
| Park Quality | 71.8 | |
| Population | 5,079 | 210,616 |
| Racial and Ethnic Diversity | 0.4 | 0.44 |