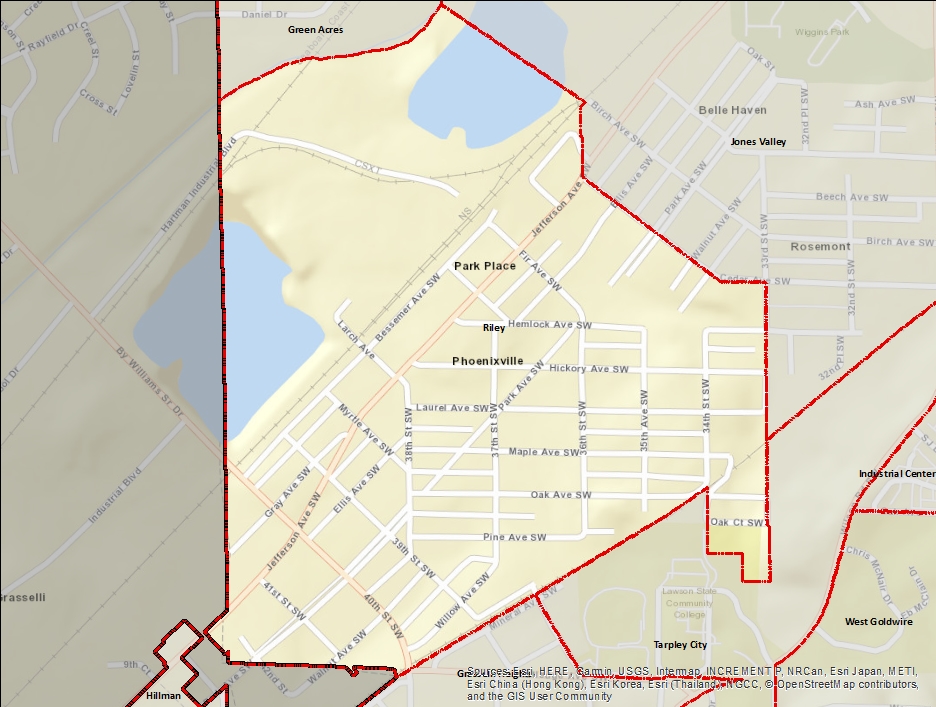
Riley
Riley is a neighborhood in the Southwest community of Birmingham. Originally called Travellick (also Trevillick), it was developed in 1888 as a community of low-cost worker's housing by the Beneficial Land and Improvement Company, headed by members of the Knights of Labor. The nearby community of Powderly was developed simultaneously and the communities were named for Richard Trevillick and Terence Powderly, two of the Knights' national leaders. he original Trevillick lots were 50 feet wide by 120 feet deep and were sold only to members in good standing. Lot owners received stock in the development company, which organized neighborhood businesses as cooperative ventures.
Indicator Details
| Indicators |
Primary Domain |
Indicator Value | Rank | Tier | Indicator Weight |
|---|---|---|---|---|---|
| Business Retention | Economic Health | -10.5% | 58 | Middle | 1.00 |
| Access to Mainstream Financial Services | Economic Health | 22.8% | 82 | Bottom | 1.00 |
| Local Business Vitality | Economic Health | 64.7% | 35 | Middle | 1.00 |
| Payday Loans | Economic Health | 3.1 | 90 | Bottom | 1.00 |
| Adult Educational Attainment | Educational Opportunities | 72.9% | 70 | Bottom | 3.00 |
| High School Graduation Rate | Educational Opportunities | 80.0% | 25 | Top | 3.00 |
| School Readiness Scores | Educational Opportunities | -% | - | Data N/A | 1.00 |
| Preschool Enrollment | Educational Opportunities | 0.0% | 87 | Bottom | 3.00 |
| Reading Proficiency | Educational Opportunities | 9.2% | 72 | Bottom | 3.00 |
| Residential Proximity to Traffic | Environmental Hazards | 0.0% | 1 | Top | 1.00 |
| School Proximity to Traffic | Environmental Hazards | 0.0% | 1 | Top | 1.00 |
| Proximity to Brownfield Sites | Environmental Hazards | 7.7% | 88 | Bottom | 1.00 |
| Toxic Releases from Facilities | Environmental Hazards | 100.0% | 75 | Bottom | 1.00 |
| Proximity to Superfund Sites | Environmental Hazards | 0.0% | 1 | Top | 1.00 |
| Public Assisted Households | Employment Opportunities | 45.4% | 53 | Middle | 1.00 |
| Employment Rate | Employment Opportunities | 88.6% | 25 | Top | 1.00 |
| Long-Term Unemployment | Employment Opportunities | 2.0% | 21 | Top | 1.00 |
| Travel Time to Work | Employment Opportunities | 24.3 | 45 | Middle | 1.00 |
| Age of Housing | Housing | 88.7% | 68 | Bottom | 1.00 |
| Blood Lead Levels in Children | Housing | -% | - | Data N/A | 1.00 |
| Excessive Housing Cost Burden | Housing | 43.7% | 65 | Middle | 1.00 |
| Vacancy Rates | Housing | 26.1% | 80 | Bottom | 1.00 |
| Violent Crime | Health Systems and Public Safety | 62.1 | 17 | Top | 4.00 |
| Chronic School Absence | Health Systems and Public Safety | 32.1% | 83 | Bottom | 1.00 |
| Low Birth Weight | Health Systems and Public Safety | -% | - | Data N/A | 1.00 |
| Motor Vehicle Collisions | Health Systems and Public Safety | 4.1 | 43 | Middle | 4.00 |
| Preventable Hospitalizations | Health Systems and Public Safety | - | - | Data N/A | 1.00 |
| Pedestrian & Bicycle Injuries by Motor Vehicles | Health Systems and Public Safety | 0 | 1 | Top | 4.00 |
| Public Health Nuisances | Health Systems and Public Safety | 97.3 | 77 | Bottom | 4.00 |
| Infant Mortality Rate | Health Systems and Public Safety | 18.4 | 86 | Bottom | 1.00 |
| Tree Cover | Natural Areas | 2.2% | 57 | Middle | 1.00 |
| Access to Parks and Open Space | Natural Areas | 77.7% | 72 | Bottom | 1.00 |
| Offsite Alcohol Outlets | Neighborhood Characteristics | 1 | 65 | Middle | 1.00 |
| Food Desert | Neighborhood Characteristics | 83.3% | 49 | Middle | 2.00 |
| Land Use Mix | Neighborhood Characteristics | 0.7 | 9 | Top | 1.00 |
| Walkability | Neighborhood Characteristics | 78.5 | 17 | Top | 4.00 |
| Residential Mobility | Social Cohesion | 91.5% | 13 | Top | 1.00 |
| Voter Participation | Social Cohesion | 5.5% | 47 | Middle | 1.00 |
| Transit Accessibility | Transportation | 4.7 | 51 | Middle | 4.00 |
| Commute Mode Share | Transportation | 12.1% | 67 | Bottom | 4.00 |
| Pedestrian Connectivity | Transportation | 100 | 51 | Middle | 4.00 |
| Household Transportation Costs | Transportation | 26.0% | 64 | Middle | 4.00 |
| Abandoned Structures | Blight | 16.6% | 78 | Bottom | 5.00 |
| Tax Delinquent Properties | Blight | 21.0% | 59 | Middle | 5.00 |
| Visual Property Nuisances | Blight | 26.3% | 83 | Bottom | 5.00 |
Demographic and Contextual Indicators
| Neighborhood | City Wide | |
|---|---|---|
| Income Inequality | 0.4 | 0.49 |
| Concentrated Poverty | 25.2% | 30.9% |
| Life Expectancy | 71 | 78.8 |
| Population | 954 | 210,616 |
| Racial and Ethnic Diversity | 0 | 0.44 |
| Park Quality | 52.6 |