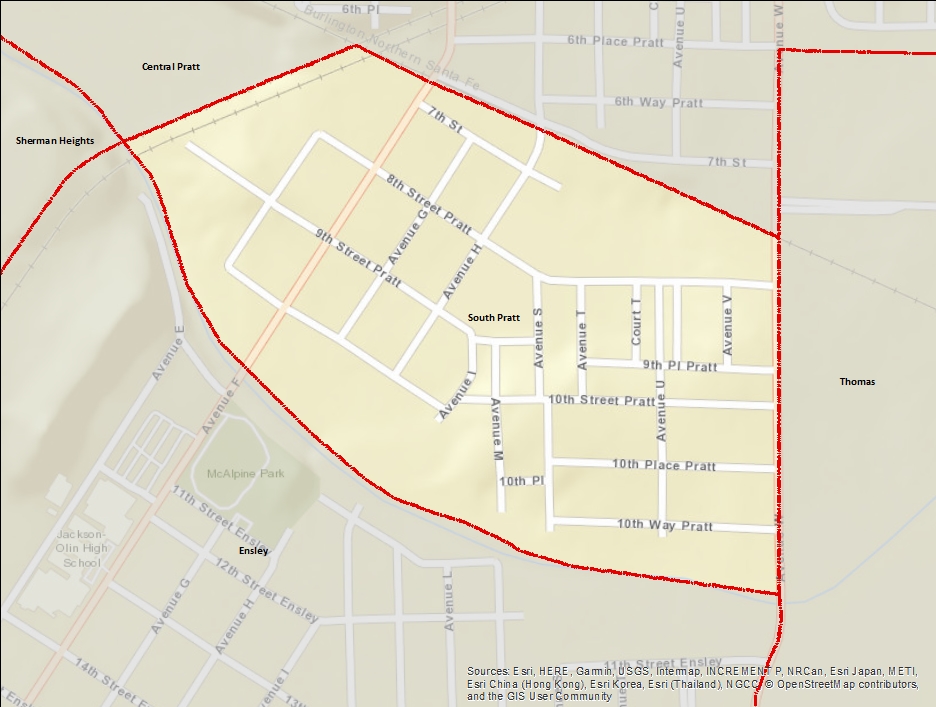
South Pratt
The South Pratt neighborhood is a neighborhood in Birmingham's Pratt community, formerly Pratt City founded in the late 1800s. The area, originally called Coketon, grew up rapidly around the Pratt Mines, which had opened in the early 1870s and expanded to become the state's largest mine complex by 1886. Pratt CIty was annexed into Birmingham in 1910. The Pratt Mines ceased operating in the 1920s, though the community remained a commercial destination until the 1950s.
Indicator Details
| Indicators |
Primary Domain |
Indicator Value | Rank | Tier | Indicator Weight |
|---|---|---|---|---|---|
| Access to Mainstream Financial Services | Economic Health | 27.5% | 70 | Bottom | 1.00 |
| Local Business Vitality | Economic Health | 40.0% | 88 | Bottom | 1.00 |
| Payday Loans | Economic Health | 0 | 1 | Top | 1.00 |
| Business Retention | Economic Health | -28.6% | 97 | Bottom | 1.00 |
| Adult Educational Attainment | Educational Opportunities | 83.1% | 30 | Top | 3.00 |
| High School Graduation Rate | Educational Opportunities | 75.8% | 65 | Middle | 3.00 |
| School Readiness Scores | Educational Opportunities | -% | - | Data N/A | 1.00 |
| Preschool Enrollment | Educational Opportunities | 0.0% | 87 | Bottom | 3.00 |
| Reading Proficiency | Educational Opportunities | 10.5% | 57 | Middle | 3.00 |
| Residential Proximity to Traffic | Environmental Hazards | 0.0% | 1 | Top | 1.00 |
| Proximity to Brownfield Sites | Environmental Hazards | 0.0% | 1 | Top | 1.00 |
| School Proximity to Traffic | Environmental Hazards | 0.0% | 1 | Top | 1.00 |
| Proximity to Superfund Sites | Environmental Hazards | 100.0% | 95 | Bottom | 1.00 |
| Toxic Releases from Facilities | Environmental Hazards | 100.0% | 75 | Bottom | 1.00 |
| Public Assisted Households | Employment Opportunities | 53.1% | 64 | Middle | 1.00 |
| Employment Rate | Employment Opportunities | 73.2% | 89 | Bottom | 1.00 |
| Long-Term Unemployment | Employment Opportunities | 5.5% | 87 | Bottom | 1.00 |
| Travel Time to Work | Employment Opportunities | 31.6 | 96 | Bottom | 1.00 |
| Age of Housing | Housing | 86.4% | 59 | Middle | 1.00 |
| Blood Lead Levels in Children | Housing | -% | - | Data N/A | 1.00 |
| Excessive Housing Cost Burden | Housing | 48.0% | 82 | Bottom | 1.00 |
| Vacancy Rates | Housing | 33.8% | 92 | Bottom | 1.00 |
| Chronic School Absence | Health Systems and Public Safety | 31.0% | 75 | Bottom | 1.00 |
| Low Birth Weight | Health Systems and Public Safety | -% | - | Data N/A | 1.00 |
| Motor Vehicle Collisions | Health Systems and Public Safety | 0.9 | 9 | Top | 4.00 |
| Preventable Hospitalizations | Health Systems and Public Safety | - | - | Data N/A | 1.00 |
| Pedestrian & Bicycle Injuries by Motor Vehicles | Health Systems and Public Safety | 0 | 1 | Top | 4.00 |
| Public Health Nuisances | Health Systems and Public Safety | 221 | 99 | Bottom | 4.00 |
| Infant Mortality Rate | Health Systems and Public Safety | 23.8 | 98 | Bottom | 1.00 |
| Violent Crime | Health Systems and Public Safety | 75.5 | 35 | Middle | 4.00 |
| Access to Parks and Open Space | Natural Areas | 100.0% | 1 | Top | 1.00 |
| Tree Cover | Natural Areas | 0.0% | 77 | Bottom | 1.00 |
| Food Desert | Neighborhood Characteristics | 100.0% | 56 | Middle | 2.00 |
| Walkability | Neighborhood Characteristics | 67.5 | 36 | Middle | 4.00 |
| Land Use Mix | Neighborhood Characteristics | 0.1 | 92 | Bottom | 1.00 |
| Offsite Alcohol Outlets | Neighborhood Characteristics | 0 | 1 | Top | 1.00 |
| Voter Participation | Social Cohesion | 6.9% | 26 | Top | 1.00 |
| Residential Mobility | Social Cohesion | 81.7% | 59 | Middle | 1.00 |
| Commute Mode Share | Transportation | 12.2% | 64 | Middle | 4.00 |
| Household Transportation Costs | Transportation | 24.7% | 46 | Middle | 4.00 |
| Pedestrian Connectivity | Transportation | 142 | 29 | Top | 4.00 |
| Transit Accessibility | Transportation | 0 | 96 | Bottom | 4.00 |
| Abandoned Structures | Blight | 21.3% | 95 | Bottom | 5.00 |
| Tax Delinquent Properties | Blight | 28.3% | 82 | Bottom | 5.00 |
| Visual Property Nuisances | Blight | 8.5% | 32 | Top | 5.00 |
Demographic and Contextual Indicators
| Neighborhood | City Wide | |
|---|---|---|
| Income Inequality | 0.5 | 0.49 |
| Concentrated Poverty | 13.6% | 30.9% |
| Life Expectancy | 70.6 | 78.8 |
| Population | 371 | 210,616 |
| Racial and Ethnic Diversity | 0 | 0.44 |
| Park Quality | 43.8 |