Redmont Park
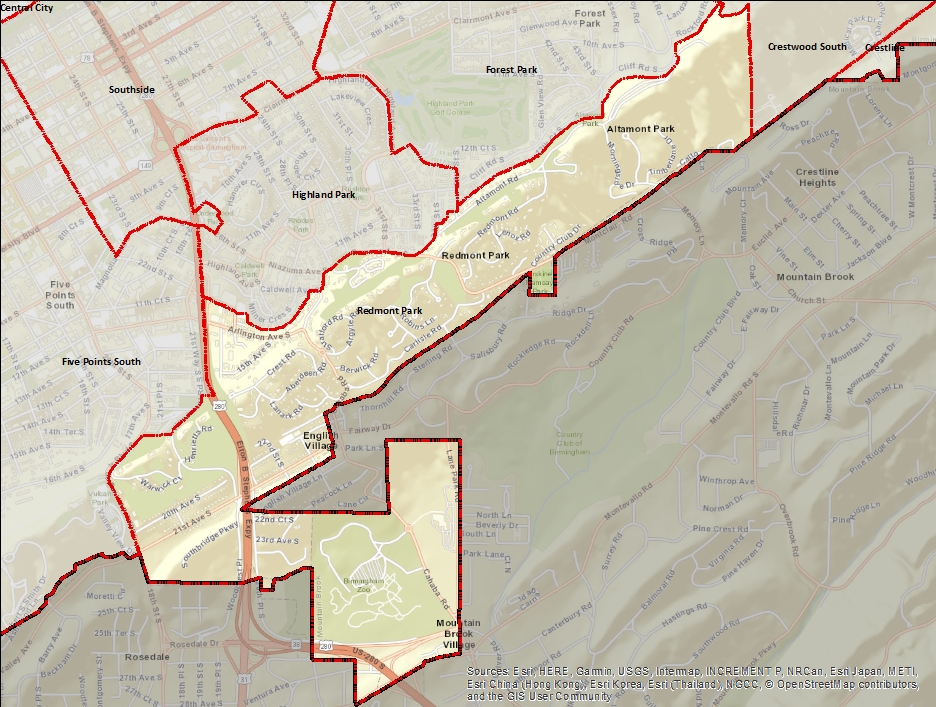
Redmont Park is a neighborhood in Birmingham's Red Mountain community. It stretches along the ridge of Red Mountain, north of Mountain Brook from Vulcan Park on the southwest to Crestwood South. The original Redmont Park subdivision was developed the Redmont Land Company, a subsidiary of the Jemison Company in the early 1920s, extending its Mountain Terrace subdivision toward the Birmingham Country Club's new location on Watkins Brook, where the company would eventually develop its new suburb of Mountain Brook. Estate sized lots were marketed for their convenience to the new country club, and sold quickly.
Indicator Details
| Indicators | Primary Domain | Indicator Value |
Rank |
Tier | Indicator Weight |
|---|---|---|---|---|---|
| Business Retention | Economic Health | -21.6% | 88 | Bottom | 1.00 |
| Commute Mode Share | Transportation | 9.1% | 82 | Bottom | 4.00 |
| Residential Proximity to Traffic | Environmental Hazards | 7.5% | 80 | Bottom | 1.00 |
| High School Graduation Rate | Educational Opportunities | 74.1% | 80 | Bottom | 3.00 |
| Reading Proficiency | Educational Opportunities | 10.3% | 62 | Middle | 3.00 |
| Pedestrian Connectivity | Transportation | 82 | 58 | Middle | 4.00 |
| Offsite Alcohol Outlets | Neighborhood Characteristics | 0.8 | 58 | Middle | 1.00 |
| Residential Mobility | Social Cohesion | 82.8% | 51 | Middle | 1.00 |
| Walkability | Neighborhood Characteristics | 55.8 | 46 | Middle | 4.00 |
| Age of Housing | Housing | 83.0% | 46 | Middle | 1.00 |
| Pedestrian & Bicycle Injuries by Motor Vehicles | Health Systems and Public Safety | 0.1 | 44 | Middle | 4.00 |
| Payday Loans | Economic Health | 0.4 | 42 | Middle | 1.00 |
| Chronic School Absence | Health Systems and Public Safety | 19.9% | 38 | Middle | 1.00 |
| Local Business Vitality | Economic Health | 63.0% | 37 | Middle | 1.00 |
| Transit Accessibility | Transportation | 5.9 | 36 | Middle | 4.00 |
| Toxic Releases from Facilities | Environmental Hazards | 39.1% | 23 | Top | 1.00 |
| Motor Vehicle Collisions | Health Systems and Public Safety | 2.3 | 23 | Top | 4.00 |
| Vacancy Rates | Housing | 12.0% | 22 | Top | 1.00 |
| Tree Cover | Natural Areas | 26.8% | 22 | Top | 1.00 |
| Voter Participation | Social Cohesion | 7.5% | 20 | Top | 1.00 |
| Infant Mortality Rate | Health Systems and Public Safety | 9.1 | 19 | Top | 1.00 |
| Household Transportation Costs | Transportation | 22.5% | 17 | Top | 4.00 |
| Access to Mainstream Financial Services | Economic Health | 47.9% | 17 | Top | 1.00 |
| Preschool Enrollment | Educational Opportunities | 46.0% | 12 | Top | 3.00 |
| Public Health Nuisances | Health Systems and Public Safety | 14.7 | 10 | Top | 4.00 |
| Excessive Housing Cost Burden | Housing | 28.3% | 10 | Top | 1.00 |
| Land Use Mix | Neighborhood Characteristics | 0.7 | 9 | Top | 1.00 |
| Tax Delinquent Properties | Blight | 0.7% | 6 | Top | 5.00 |
| Public Assisted Households | Employment Opportunities | 9.8% | 6 | Top | 1.00 |
| Long-Term Unemployment | Employment Opportunities | 0.9% | 5 | Top | 1.00 |
| Travel Time to Work | Employment Opportunities | 17.9 | 5 | Top | 1.00 |
| Violent Crime | Health Systems and Public Safety | 32.3 | 5 | Top | 4.00 |
| Abandoned Structures | Blight | 3.1% | 5 | Top | 5.00 |
| Visual Property Nuisances | Blight | 0.8% | 3 | Top | 5.00 |
| Employment Rate | Employment Opportunities | 96.7% | 2 | Top | 1.00 |
| Proximity to Brownfield Sites | Environmental Hazards | 0.0% | 1 | Top | 1.00 |
| School Proximity to Traffic | Environmental Hazards | 0.0% | 1 | Top | 1.00 |
| Proximity to Superfund Sites | Environmental Hazards | 0.0% | 1 | Top | 1.00 |
| Access to Parks and Open Space | Natural Areas | 100.0% | 1 | Top | 1.00 |
| Adult Educational Attainment | Educational Opportunities | 95.4% | 1 | Top | 3.00 |
| Food Desert | Neighborhood Characteristics | 10.5% | 1 | Top | 2.00 |
| Preventable Hospitalizations | Health Systems and Public Safety | - | - | Data N/A | 1.00 |
| Blood Lead Levels in Children | Housing | -% | - | Data N/A | 1.00 |
| Low Birth Weight | Health Systems and Public Safety | -% | - | Data N/A | 1.00 |
| School Readiness Scores | Educational Opportunities | -% | - | Data N/A | 1.00 |
Demographic and Contextual Indicators
| Neighborhood | City Wide | |
|---|---|---|
| Income Inequality | 0.5 | 0.49 |
| Concentrated Poverty | 9.6% | 30.9% |
| Life Expectancy | 79.8 | 78.8 |
| Population | 2,661 | 210,616 |
| Racial and Ethnic Diversity | 0.5 | 0.44 |
| Park Quality | 90.8 |